Evidence for the slope of the supply curve
This is a companion post to the previous one. In that post I argued that NGDP was superior when the supply curve is nearly flat, in this one I argue that the empirical evidence strongly favours a flat supply curve at the following times.
What follows are a series of plots of RGDP vs NGDP with associated trend lines.

We are looking at the slope of the supply curve.
The gradient of this graph is 0.55, it shows a reasonable correlation of 
Now lets look at 1990-Present, i.e. the era of low inflation. Now we see:

This shows RGDP vs NGDP 1990-Present
Note that now, in this era, a 1% point rise in NGDP is associated with a 0.85% rise in RGDP. I.e. The supply curve is very flat. This is exactly the danger area identified in my previous post, where in order to reduce inflation by a small amount, one must sacrifice a huge amount of output. A 1% reduction in inflation would correspond to a 6% reduction in output. Note also that the correlation is a lot better in this era, than in the whole data set. This should increase our confidence that this is a meaningful subset – i.e. that there is something qualitative different about this selection of points from a random sampling. In this case, the adoption of a low inflation target.
We can also estimate “expected inflation” from this analysis. Expected inflation is the level of NGDP growth needed for RGDP to be flat, so in this case, 1.44/0.849 = 1.7%. Since this is close to the inflation target, that is further evidence that this analysis is meaningful.
Lets look at the 1970’s. We might expect that this is a time when we got onto the vertical part of the supply curve, :

Note that even in this era, the supply curve appears flat, it just has an enormous intercept.
This time we have an expected inflation reading of 6.5%, along side an almost identical gradient. We can say here with some confidence that inflation expectations were higher in the 1970’s, but what to make of the identical gradient? I expect what we are seeing here is expectation adjustment. Every time the expectations adjust you get moved back onto the flatter part of the supply curve. This is the theory of the inflation adjusted Philips curve. This causes the correlation to break down, as a change in inflation expectation moves the whole line up and down.
Lets look at this era in more detail:

This shows how inflation expectations developed
Here are two periods, Oct 68 to Jan 72, and Oct 73-79/01. In both of these periods we get pretty good correlations, but inflation expectations have jumped, and the supply curve becomes even flatter. Perhaps what is happening here is that as uncertainty about inflation becomes chronic, output falls, and we get onto the flatter part of the supply curve. Here inflation expectations jumped 5 percentage points in a few years. This is indeed puzzling. Perhaps the real lesson here is that the supply/demand framework does not work well without a nominal anchor around which to have “unexpected” stimulus.
Nevertheless, the broad point stands: Throughout the 1990’s, the trade off between inflation and output was terrible. Thus, attempts to keep inflation on target by tightening policy in response to a 1% supply side shock to prices, would result in around a 6% loss of output. Given the small costs of small deviations from the inflation target, central banks should be prepared to tolerate deviations from the inflation target, provided that they are doing so in order to keep aggregate demand more stable, because the costs of a loss of demand are huge, and the costs of missing your inflation target are tiny.
Nowhere is this more clear than in the 2011 rate tightening of the European Central bank, which in order to prevent a small overrun in its inflation target, was forced to induce a catastrophic loss of demand.
Visualising NGDP Targeting
The AS-AS framework gave rise to one of the iconic images of Economics. Almost everyone who has studied or followed economics will have seen a version of the following diagram:

The AS-AD Diagram – from Wikimedia commons
Now, the stylised facts of this diagram are these
- The supply curve is upward sloping : A higher price usually means a larger quantity can be produced. Think of how a higher price of Oil makes hard to reach reservoirs economic.
- The supply curve goes vertical at some finite level of output. This represents real constraints on production in the economy.
- The demand curve is downwards sloping – generally people buy a larger quantity of stuff when its cheaper.
We can understand the inflation targeting regime through the lens of this diagram. A supply shock moves the supply curve upwards. In order to return to the target price level, the central bank must move the demand curve leftwards. This is the reason to believe that inflation targeting is a sub-optimal strategy for a central bank – in this framework, in response to a positive supply shock, which decreases output, a central bank must deliberately generate a further fall in output in order to get inflation back to target. Think about that – in order to keep inflation on target in the face of a supply shock, we must deliberated produce less than we could. Moreover, in the real world, a loss of demand almost always means a rise in unemployment. So we are deliberately trading unemployment and lost production for in order to hit a 2% target.
The reverse happens in a positive supply shock. This time the supply curve is lowered, so the central bank shifts the AD curve rightwards. This rise in demand leads to a boom, and when the supply shock passes we find that the aggregate demand curve is too far to the right (policy is suddenly too loose) and we get a spike in inflation.
In the real world, its fair to say that we don’t “know” the shape of the supply curve and the aggregate demand curve. All we can measure is the cross over which actually happens i.e., we can measure the price level and RGDP and Lets specify aggregate demand by: 


This diagram is just the AS-AD diagram with a third axis drawn on to represent NGDP. The red lines are lines of constant NGDP. The inspiration for this was Minkowski diagrams for switching between space time frames by drawing on the a second frame of reference.
A supply shock hits the economy, and as a result the supply curve moves from A to B. Originally, this moves us from the point marked start, to the point marked NGDP. Under NGDP targeting, this is where the story ends, as we have moved along a line of constant NGDP. We have some slightly higher inflation, and a small decrease in output, but this output loss was inevitable, as the new supply curve goes vertical well below the original level of output. Under inflation targeting, the central bank now forces AD/NGDP onto a lower path, inorder to return the price level to its starting value, Pi. This cause output to drop from Yn to Yi. In the example that I have drawn, where the supply curve is fairly flat, the decrease in output needed to bring inflation back to its starting value was far larger than the original loss of output. This is the disaster scenario for inflation targeting, where a large loss of output is required to correct a small change in inflation. This is arguably what happened in the US in 2008, and almost certainly what happened to the Eurozone in 2011, where policy makers focused on inflation, traded catastrophic falls in output to a void small overruns in inflation.
Of course, if I had moved the start point up onto the nearly vertical part of the supply curve, then we could have traded a tiny loss in output for quite a large change in the price level. Arguably, this was the story of the 70;s and 80s, where they were in a reasonably high inflation regime, and this put them well onto the vertical part of the supply curve, this, huge changes in inflation translated into only small changes in output.
On more nice thing about this diagram: it makes it clear that what we actually have are two `real’ things, the supply curve, and the demand curve. But these are unmeasurable, and we can specify the outcomes (where the curves cross) using any two of NGDP, real output, and the price level. The price level/Real output specification seems to have an almost sacred place in economics. When given a choice of equivalent decompositions, it is almost always right to thing in terms of the things which are easiest to measure. Here that ist he Price Level, and NGDP. An independent measurement of real output is almost impossible, as it would depend on some kind of notion of intrinsic value, so in practice, RGDP is measured by applying an inflation correction to NGDP. By using a Y,P decomposition, you are cross-correlating your measurement errors.
Finally, NGDP targeting always leads to a smaller output gap but higher inflation than IT when faced with a supply shock. If we are on the flat part of the supply curve, that is a good thing, if we are on the vertical part of the supply shock, that is a bad thing. given the general downards stickiness of inflation despite enormous falls in output in the US, UK, and EZ, we are definitely on the flat part of the curve, and so should be looking to NGDP growth, rather than inflation, to guide policy.
How Much do NGDP expectations matter to the Stock Market?
The inspiration for this post was a brief discussion with a friend, when I attempted to explain why I think of the stock market as a prediction market for NGDP. We might pose the following question, if NGDP expectations were to increase from 5% per year to 6% per year for every year from now to forever, how much would that matter to the stock market?
The short answer is, a lot.
To answer this, lets take a slightly round about route of asking, what is the Net Present Value ,

There is some evidence that we might expect it to be at the higher end of this range going forward due to having more tech with higher profit margins, and more overseas earnings. So lets assume that this is stable at 


Where we have 
Given the assumptions above, if we assume that everything grows at a stable growth rate (i.e we are ignoring possible path dependency), then
So a 1% increase in NGDP gives about a 40% increase in the stock market, as a handy rule of thumb. No wonder the stock market loves QE!
If we take the EMH seriously, we must conclude that the combination of low TIPS spreads predicting low inflation, and a booming stock market predicting high NGDP, means that we can expect productivity/RGDP to come roaring back any minute now. A market Monetarist argument for Supply Side Optimism. Yes, I’m looking at You Britmouse. 🙂
BOE’s Inflation Report
So I had a look at the FT’s coverage of the inflation report, and it brought up one of my pet peeves about the commentary on the crisis, namely, measures of economic slack.
The bank of England apparently thinks that there is around 1.5% of slack in the economy. My first pet hate is that “slack” is not adequately defined in this context. Does this mean that Carney thinks that RGDP will develop a new trend line that is only 1.5% higher than the current level and at around 2% a year? Or does this simply mean that at the current moment companies estimate that with their current personnel and facilities they could only increase production by 1.5%.
This is important because there are two types of “slack”, there is the measure of “could we do more right now”, and there is the measure “given greater demand could I deploy more employees, capital, and technology to increase supply”. I am pretty sure the BOE’s estimate is about the former, but the macroeconomically important version is the latter. In other words, the supply side constraints could be soft for a while, if technological improvements since 2008 have enabled greater production, but they just haven’t been deployed due to weak demand.
Lets take a quick look at the RGDP (constant prices):

Does this look like an economy with only 1.5% slack? Is it not possible that in the medium term we might recover nearly all of our lost productivity? Might we not find that as demand grows aggregate supply just continues to quietly grow so that the BOE’s measure remains stuck at 1.5% while GDP grows 4-5% a year for a number of years?

Stolen from an ONS publication, does this look like an economy with only 1.5% slack? Are you telling me that after 7 years of technological progress, the BOE expects slack in GDP to be exhausted before productivity per worker has even reached its 2007 high?
Are we really to expect that some (minor) institutional differences will mean that UK workers will not, over the medium term, enjoy the same advances that have allowed US productivity to grow 20% in the same period? The UK is structurally similar to the US, but the structural differences (might) mean that in the UK we get more hiring first, and productivity growth later, and in the US they get more productivity first, and then more hiring. That certainly seems more plausible to me than that the differences in our institutions mean that the UK will not benefit from the same advances of the US in the long run. In that case, the technology exists already for a 20% rise in productivity in UK workers.
The real problem here is that the BOE is giving a short term definition of slack, where it doesn’t assume anything about the future investment and employment and capital improvement programs of enterprises. It just asks about capacity utilisation right now. Which, immediately following a recession, is a sensible enough thing to do. The problem is, that here we have moved into the medium term. There has been technological progress in that time, and the fact that this is waiting in the wings means that we should not regard current utilisation as in anyway a meaningful indicator of “slack”.
I predict that productivity per worker will recover its century long trend line of 2% a year growth. In that case, “slack” in the economy is more like 15% than 1.5%. Capital spending, training workers on new technology, the rise of robotics and machine learning will do the heavy lifting over the next 3-5 years, and we can expect strong growth along side benign inflation until we approach this productivity trend line.
Update to Wage Growth Does Not Necessitate Inflation
Marcus Nunes left a link to a Cleveland Fed Paper which has some interesting remarks about wage inflation and price inflation:
…since labor costs are a large fraction of a firm’s total costs of production, rising wages and compensation should put pressure on firms to pass these higher costs on as higher prices. We have several reasons to doubt the accuracy of this view. First, if a wage increase is brought about by increased labor productivity, it will not create inflationary pressure.3 Second, a wage increase will not create inflationary pressure if it leads to a squeeze in profits because a firm cannot pass along cost increases. No firm inherits the right to simply “mark-up” the prices of its output as a constant proportion above its costs; competitive market pressures strongly influence the pricing decisions of firms. Finally, causation could work in the opposite direction: An increase in aggregate demand may permit firms to raise the price of their products, and the resulting increase in profits would lead workers to demand higher wages in future negotiations.
And just in case you missed their meaning…
It turns out that the vast majority of the published evidence suggests that there is little reason to believe that wage inflation causes price inflation. In fact, it is more often found that price inflation causes wage inflation. Our recent research, which updates and expands on the current literature, also provides little support for the view that wage gains cause inflation. Moreover, wage inflation does a very poor job of predicting price inflation throughout the 1990s, while money growth and productivity growth sometimes do a better job. The policy conclusion to be drawn is that wage inflation, whether measured using labor compensation, wages, or unit-labor-costs growth, is not a reliable predictor of inflationary pressures.
So if the hawks could all stop clamouring that a tighter labour market means the start of a wage-price spiral of death, that would be great, and dare I say it, rational.
Wage Growth Does Not Necessitate Inflation
There seems to be a certain segment of the economic commentariat who believe that whatever the reason, tightening is the answer. The latest reason to tighten is that there is evidence that the labour market is tightening. Wage growth in the US is staging a modest recovery.
However, this does not imply that the CPI is going to rise. Lets have a quick look at average hourly compensation vs inflation since 2000.

Compensation and Inflation
We can see that inflation and wage growth typically track each other fairly closely. This correlation is likely spurious, an artefact of the fact that productivity growth and population growth have similar magnitudes. I am more interested in the effect of total compensation on inflation. Since the argument goes that wage growth leads to inflation, lets note first that wage growth is still far below historical norms.
Inflation is generated when demand outstrips supply. Labour market tightening means that workers have better bargaining positions, and then can bargain for better wages. Wage growth is coming, and wage growth means rising AD, but inflation comes only when AD outstrips AS. There are two reasons that that this might not happen at once:
(1) Productivity growth. It is a feature of recessions generally that Capex falls because companies do not invest in productivity enhancements in an environment of weak demand. Technological progress marches on regardless, and the result is that there is a steady stream of available but unbuilt productivity enhancements that a company could invest in. Thus we should expect that productivity growth could stage a catch up. This is supported by the general observation that RGDP has grown on the same trendline for decades, and it would be a remarkable coincidence if trend growth had a secular change exactly at a time that happened to have a financial crises.
(2) Corporate Profit Margins. CPI measures consumer prices, which is not quite the same thing as monetary inflation. This is punishing on the way down, when consumer prices do not fall in line with the changing money demand, but can be beneficial on the way up. For example, a decline in corporate profit margins as a tighter labour market allows workers to capture more of their marginal product can give you rising demand without rising consumer prices.
The economy is complicated, and no one can predict what will happen with perfect certainty, but you should not give undue credence to those who tell you that rising wage growth is certain to generate inflationary pressure. As in the late nineties, wage growth can be large while inflation is low for years at a time. We have two plausible stories that can support the hypothesis that this is a likely outcome, it is certainly where I would place my chips.
Transmission Channels of Central Banking and QE
The QE debate has spawned a renewed interest in the transmission channels of Central Banking. For a long time through the Great Moderation, all central banks were using the interest rate channel, and that alone was sufficient. In fact, so successful has this channel been, that people seem to have forgotten the other transmission channels. The diagram below summarises the traditional transmission mechanisms of central banking, courtesy of Mishkin:

These channels are separated into three broad channels, interest rate, other asset price effects, and the credit channel. In my view there is at least one more channel that should be mentioned explicitly, and that is expectations. However, expectations are implicit in nearly all of the channels. Even in the interest rate channel, expectations for the ten year yield often start falling dramatically even before the Fed cuts rates, since expectations of recession fuel expectations of a rate cut, and can ease policy dramatically even before the Fed takes any “concrete steppes”. It is for this reason that Lars Christensen and Scott Sumner continually say that Monetary Policy works with “long and variable leads”. Indeed, in the run up to the financial crises one could argue that the Fed’s decision to leave rates on hold at 2% in mid 2008 represented such a passive tightening compared to expectations, which led to a spike in the ten year yield. I would not argue thus, arguing quite the reverse, that the Fed’s belated cut to 2% showed the Fed was “taking it seriously” and this raised expectations of future growth, At that point perhaps most actors were still foreseeing a garden variety recession, then in late 2008 it all started getting worse again and long rates plunged and expectations fell. Then QE came along and raised them again. Let me note again for clarity, that I do not believe this argument, but if you think that the interest channel is the primary channel of monetary policy, as reflected in the long rates, then you must believe that the Fed tightened policy relative to expectations in mid 2008 when it lowered the Fed Funds rate to “only” 2%. My only point here is to shine a light on the difference in interpreting the effects of monetary policy moves. Market monetarists believe that lowering the fed funds rate always and everywhere leads to higher NGDP expectations and hence higher ten year rates.

Did the Fed’s failure to cut rates to zero represent a passive tightening? Looks that way.
At any rate, the main point of this post was to look at transmission mechanisms for QE. The first and most important thing to notice is that QE does not work by “holding down interest rates”. In fact it has the reverse effect. Every episode of QE has been associated with rising interest rates. To many people it seems “obvious” that buying securities “must” hold down the rate, so let us reflect on this, and the general unreliability of interest rates as a measure of, well, anything. Firstly, it is the case that ten year rates are highly correlated with expectations of NGDP growth. This is because if I expect ten years of 5% NGDP growth, then I can obtain 5% nominal growth risk free by buying a portfolio which is representative of the “whole economy”. Admittedly this is not likely true in practice, but any risk free security should be priced according to this ideal. Thus rising real rates are correlated with higher real GDP in the future. We should therefore conclude that if QE leads to rising nominal long rates, then it is because one of the other transmission channels overwhelms the interest rate channel, and leads to rising rates based on recovery expectations despite the headwinds that a rising interest rate has on growth. Indeed, some support was given to this view by a careful analysis of correlations between gdp growth and long interest rates by the econtrarian – which showed that rising 10 year interest rates are strongly correlated with GDP growth.
Of course, it can be even more complicated than that. After all, the stimulative effect of low interest rates is driven by the difference between the current cost of capital and the Wicksellian real interest rate. As David Glasner has pointed out, if rising demand causes the Wicksellian rate to rise, the stimulative effect of low interest rates can rise even as long rates rise, if they rise less slowly, and it is perfectly consistent to believe that. I.e., to believe that QE does hold down rates relative to the counter factual where stimulating the economy was achieved through some other channel than buying securities.
Now there are several channels through which QE may effect the economy. The first is that by holding down MBS relative to other corporate credit, it has lowered mortgage rates and this has supported the housing market and allowed households to refinance at lower rates and so supported consumption. The second are portfolio balance and wealth effects, and the final one is the signalling effect(into which I group changes in inflation expectations).
The first of these needs little explanation, but there is some evidence that this has been a major factor. A recent Jackson Hole paper (this I think – same authors anyway), one criticism I would level is that their event analysis on QE announcements is very short term, and so misses the dominant narrative to liquidity effects. Nevertheless, by looking at many different channels, they find that QE has had a lot of small effects which adds up to quite a big effect, and it is an excellent paper for illuminating the many different effects that QE has in the economy.
Portfolio re-balancing effects are the Fed’s fancy name for what Scott Sumner calls “the hot potato effect”. Suppose that the public, in general, have some preferred portfolio of assets. If you go and buy some assets, you take them out of circulation, however, whoever you bought them off must now hold more cash than he desired. Said investor will now try to get rid of his excess cash by buying something else (either consumption or another asset). However, in aggregate the public cannot “get rid” of their cash, so they must return to their preferred portfolio through a complicated series of transactions that ends up, eventually, in the adjustment of prices. Part of this adjustment involves bidding up asset prices, in the expectation that in the new equilibrium there will be more spending, and hence a higher nominal return. We can see this in action in this graph of corporate profit forecasts in Japan, produced by Pragmatic Capitalism

This is the graph of forward earnings for the major stock indices.
Asset prices rise, because they forsee a future in which spending is higher, and hence revenues and profits are higher. Note that we expect this to be both nominal and real improvement, if the economy was at capacity already before QE was undertaken, we would expect only a rise in the price level, and no rise in output, with developed economies still far from capacity, we forsee both a rise in real output and a moderate increase in the price level, both of which drive corporate profits higher. (As previously pointed out QE does not actually improve corporations nominal financing position).
This is exactly Hume’s age old thought experiment about doubling the amount of gold in circulation will eventually double all prices and lead to no one being better off. Similarly, the creation of cash drives the economy towards a new equilibrium where every economic actor holds cash in the exact same proportion that they did pre-expansion. The process of adjustment is not guaranteed to be quick, but by controlling the stock of money the Fed can control the end point. Note that since M2 >>> Monetary Base, it requires incredibly large proportional expansions in base money to “make up for” quite small declines in lending. It was a failure to appreciate this point that has led to chronic deflation in Japan: Lars Christensen produced this scary graph:

We can understand this immediately by looking at the Japanese Money supply – the central bank made no attempt at all to offset the sharp departure from trend growth in the money supply, and the result was chronic deflation. Some of this was hidden by the divergence of the CPI and the GDP deflator shown above.

Note that since the money expansion in 2002 was expected to be temporary – money growth was restricted in the years following QE, and indeed, in 2006 the BoJ raised interest rates, as inflation was getting out of control, it almost reached one percent – it had little effect on the CPI. Indeed, the Japanese Phenomenon is best understood as BoJ targeting zero percent inflation in the CPI, which is exactly what it achieved.
We should also note that, quite apart from the portfolio affects listed above, higher equity prices makes investment cheaper. Not all investment is funded through bonds, and many actors prefer not to be over-leveraged, and so they may issue equity capital instead of bonds. Higher equity prices stimulate investment through this channel also. There may also be a “wealth effect”, in that those saving for pensions may save less on seeing their portfolio grow in value, and lower saving rates lead to more consumption.
Finally, we get to signalling effects. Signalling effects on real interest rates are important, because they help to shape future expectations. The Evan’s rule, in which they promised not to taper until unemployment reached a certain threshold resulted in a larger move in yields than either of the previous rounds of QE, as it helps shape expectations of future fed policy. In particular, if you as an individual have a worse expectation than the market consensus you will expect more asset purchases, which will moderate up your view of future growth, and so it acts like a positive feedback measure on expectations. Moreover, since expectations of future demand are exactly what drives investment now, raising expectations can have concrete effects in the present. I will write more on the expectations channel in a future post.
In conclusion then, I think that QE works neither through “holding down long rates” as some old style Keynesians apparently believe, nor through “expanding bank lending”, but through expanding the cash base of the economy, which leads to higher expectations of future nominal growth, and hence, more investment in the present. Added to this are the small but not negligible effects of holding down mortgage rates relative to other securities to allow cheaper refinancing, and the direct effect of rising wealth on consumption, mainly through a reduced saving rate for retirement by both persons and corporations (do not forget that low long interest rates make defined benefit plans much more expensive).
About that housing boom….
It didn’t exist. No Seriously. There was no boom in housing construction.
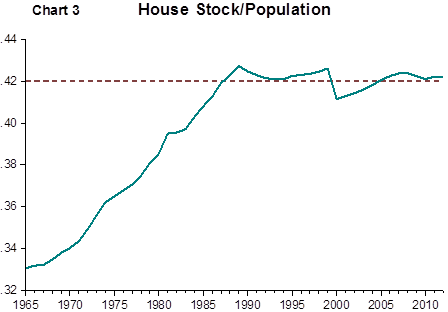
The constructing in US housing was exactly what was needed to maintain the housing-population ratio in the face of increased population growth. You cannot have an “unsustainable boom” without oversupply. If you are building exactly the amount that you need, and prices are rising anyway, it is the very definition of a sustainable boom.
Its true that housing prices rose and then fell, but they fell exactly the amount that you would expect when there was a peak to trough fall in national income. What does that prove except when people are poorer they will pay less for housing. A change in prices is never the cause of anything, it is always the result of something. The correct way to reason is not “why did an asset crash cause a recession” it is “what caused asset prices to crash”.
Aggregate demand is the only story. The world’s central banks let it fall off a cliff in 2008, when they could have prevented it, purely because they were focused on inflation and forgot about nominal income. They assumed that because, historically, inflation and NGDP had been pretty well correlated, that controlling inflation would automatically control aggregate demand at a healthy level. They, in fact, made exactly the mistake that others accuse banks of having made – that they showed too much trust in their theory and didn’t have enough prudence. If the central banks had been watching aggregate demand, this recession could have been a non event.
HT to Marcus Nunes for the graph.
The Apple Tax Senate Hearings
So I did not follow these in particularly great detail, but one thing did catch my ear. Senator McCain accused Apple of pernicious practices which violated the “spirit of the Law”. I really have no time for this argument. If they are interpreting the Law in a manner which the courts uphold as justified, then they are in the clear. In fact, I would say that it is an excuse that politicians use for writing law that is so riddled with contradictions and conflicts as to be essentially garbage.
It is literally the job of legislators and lawmakers to write laws which are clear, concise, and unambiguous. It is a basic requirement of competent government, that the powers that be should be capable of writing Law that does what then intend for it to do. Claiming that a company “violated the spirit if not the letter” is just having a tantrum because you aren’t willing to admit your own incompetence. Its childish and disingenuous.
Understanding Interest Rates
Ever since Scott Sumner suggested that someone needs to put together a model for market monetarism it is something I have been thinking about. My background is physics, and I have had only a very limited exposure to the world of building economic models, but it seems that most macroeconomic models are some form of equilibrium analysis. Market monetarism is fundamentally about disequilibrium.
This post introduces the concept of the natural rate of interest, and shows how changing the interest rates allows one to introduce disequilibrium and hence violate some of the most fundamental accounting identities, that much of equilibrium analysis 101 depends on.
Let us make a few assumptions about how the world works. First, actors have a savings preference, 


Let us assume that this expression is invertible for 


By construction then, the total amount of saving is 


We can now write down the national expenditure identity:

Now the three terms are clearly understood. The first is consumer spending, which is income less savings and taxes, the second is capital spending, and the final one is government spending. Since everyone’s spending is some one else’s income, we should have GDP=GNI, However, this type of equilibrium analysis misses the point, as my spending is based on my previous income. If we imagine that everyone is paid once a year on a particular day, then we see that our years expenditure, saving etc, its based on our previous income. Let us assume that the real production of the economy is fixed. Then if the interest rate is at the `natural rate’, and the government runs no deficit, then we get zero expenditure growth – the price level is fixed. If the right hand side is greater than GNI, then you get price inflation. This can happen in two ways, either 
Now we can draw three very important conclusions from this simple analysis.
(1) Firstly, the natural rate of interest is not stable, it depends on those real factors which determine the marginal rate of return on capital. My own preferred narrative is that every so often a disruptive technological shock comes along, like mass production, and suddenly there is lots of very productive capital spending opportunities. In order to get more savings to meet demand for capital spending, interest rates rise. Slowly the economy fills the available capital opportunities through innovation, and so we get a slow and steady decline in the natural rate of interest, until we get the next technology shock. Demographics are also an issue, as saving behaviour is not constant for individuals over their lifetime. In short, high interest rates signal high demand for capital.
(2) The accounting identities like GNI=GDP, and S=I, so familiar from classical economics, are equilibrium conditions which do not need to hold in the real world. They implicitly assume that expenditure and income occur at the same time. The insight that there is a time lag between income and expenditure, creates the conditions for the possibility of disequilibrium. We can also frame this as an expectations issue. If I foresee declining income, I can reduce expenditure now, either way, it is the difference in time between expenditure and income which creates the possibilities.
(3) Now, if we hold potential production constant, then we get inflation, essentially, if GDP now exceeded the previous time period’s income. The paradox of thrift is now easily explained. We set the interest rate at the natural rate, such that S=I, and we have no deficit so GNI*T=G. All of a sudden there is a real shock causing a fall in income. If we allowed perfect elasticity in the price level, we get instant deflation, and say’s law is enforced. In practice, we get a stable price level and falling real output. This results in unemployment. Those workers who are still employed are now over capitalised. Thus capital spending falls. Of course, due to unemployment, saving also falls, but barring an absurdly fortune cancellation, savings will no longer equal investment, at the current interest rate. In other words, real shocks shift the natural rate of interest, and produce monetary disequilibrium. This is what Keynes called the paradox of thrift: People save too much in a recession, however, what really happened was that the natural rate of interest is lowered, and hence, money is much too tight. This means that monetary policy essentially causes the recession by not being omniscient. If we want to return GDP to potential, we must shift the interest rate, or increase G. These are basically equivalent strategies. (As economist Hulk tweets:HULK CONFUSED BY @EDBALLSMP. WANTS FISCAL STIMULUS BUT TO KEEP 2% INFLATION TARGET. HULK NOT AWARE OF MACRO MODEL WHERE THIS MAKES SENSE. ) Both will raise GDP compared to GNI. Monetary dominance is also a feature here. If we assume that the central bank will manipulate the interest rate so as to produce two percent inflation, that means that the central bank chooses an interest rate such that GDP exceeds GNI by two percent, by insuring that the interest rate is chosen such that 
When a student asked Richard Feynman for advice to graduate students, he wrote a single word on a piece of paper:
Disregard.
His point being that if you want to advance understanding, you should pretty much ignore the consensus. Of course, that is a bit easier to do if when you hand in your thesis you have already produced seminal contributions to Quantum Field Theory and helped build the atomic bomb. Perhaps not great career advice for us lesser mortals. Anyway, my point is that I have really no idea if the idea’s laid out above are common knowledge in economics or not. I like economics, but I have limited time, and its not my only hobby. 🙂 I would like to build an economic model that is tractable and comprehensible and demonstrates monetarism in action. This post is hopefully a first step in that direction. Its certainly the first collection of thoughts that I have managed to gather up into a reasonably coherent framework. I had fun thinking about this stuff, so I hope you guys enjoyed reading about it.
