How Much do NGDP expectations matter to the Stock Market?
The inspiration for this post was a brief discussion with a friend, when I attempted to explain why I think of the stock market as a prediction market for NGDP. We might pose the following question, if NGDP expectations were to increase from 5% per year to 6% per year for every year from now to forever, how much would that matter to the stock market?
The short answer is, a lot.
To answer this, lets take a slightly round about route of asking, what is the Net Present Value ,

There is some evidence that we might expect it to be at the higher end of this range going forward due to having more tech with higher profit margins, and more overseas earnings. So lets assume that this is stable at 


Where we have 
Given the assumptions above, if we assume that everything grows at a stable growth rate (i.e we are ignoring possible path dependency), then
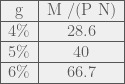
So a 1% increase in NGDP gives about a 40% increase in the stock market, as a handy rule of thumb. No wonder the stock market loves QE!
If we take the EMH seriously, we must conclude that the combination of low TIPS spreads predicting low inflation, and a booming stock market predicting high NGDP, means that we can expect productivity/RGDP to come roaring back any minute now. A market Monetarist argument for Supply Side Optimism. Yes, I’m looking at You Britmouse. 🙂
Fund Managers and Passive Investing
The fund management industry has been getting a lot of bad press recently. Firstly because so many of them fail to beat simple strategies like investing in a FTSE100 index tracker. Of course, in aggregate the fund universe is the stock market, so its clearly impossible for them to beat the stock market in aggregate. Ironically, if all the funds controlled by active fund management where placed in passive funds, it would create exactly the situation needed for the fund management industry to create alpha and thrive.
However, its especially hard to understand, because almost every other passive strategy, e.g. buying an equal weighted portfolio instead of a cap weighted portfolio like the FTSE100, will massively outperform a cap weighted index. The Nasdaq-Apple phenomenon illustrates precisely the danger of Cap weighting. At one point Apple comprised nearly 40% of the index (it was later limited to 20% by official decree), which means that you are not getting the benefits of diversification that you would expect in a portfolio, since most of your value is in a handful of positions. The top ten positions of the S&P500 have 20% of the value, you need just 32 to companies to have half the index by value. The bottom fifty companies make up just 1% of the market cap. Is it really worth the trading costs to rebalance 50 positions worth just 0.02% each? Its trivial to see that if every company has identical profiles, the minimum variance portfolio will be equally weighted.
We have not even talked about Fee structures. Many funds have total expense ratios exceeding two percent. Truly awful. Investment trusts as a group seem to do better, averaging about 1%. Still, in all this, I came across a surprising graph in the small cap sector:

Virtually every small cap fund substantially outperformed the FTSE small cap benchmark over three years. That blue dot over on the left is the benchmark. Risk is vertical and return is horizontal.
I have no idea how this can even be true. Perhaps the FT is selecting only the best performers. Perhaps many or most small cap funds are actually only partially invested in small caps? Here is the graph for Flex cap equity.

Again the Benchmark seems to be a bizarrely low performer.
These graphs were quietly snipped of the FT website, but again, the FTSE all share has indeed managed just 2.5% annualised, so it seems plausible that their `flex cap’ index might have done this badly. But how can every fund outperformed so massively? A quick check on my morningstar driven research platform finds 28 small cap funds, but only 9 of them are more than three years old.
Does the fund industry routinely close and reopen funds in-order to erase the memory of bad performance? This is really the only possible explanation. No wonder funds look attractive to retail investors when fund managers continually erase fund that under-perform the index, and only those that look good survive.
If that is what is happening, the regulators ought to step in, as these graphs are deeply misleading, despite being superficially accurate.
However, there is a slight upside in this for the retail investor. If funds are killed of for relative under performance (and your money returned), then sooner or later you will end up in a fund that is beating the index. Of course, if that out performance is essentially random, then you would be better off indexing and saving your fees, since it is impossible to generate useful work from a random process*. On the other hand, if manager out performance is persistent, and there is reasonable, though not conclusive, evidence that it is, then sooner or later you are likely to end up in a winner. This is interesting enough that I would like to model it. Does anyone have access to fund data including funds that were closed? Ten years would be enough.
*Yes, I did just apply the second law of thermodynamics to Finance. It really works too. Try this brain teaser: suppose you wish for a population to have more boys than girls, is there any strategy which can produce this result? Strategies like: I will keep having children till I get a boy. I will continue having children till I have more boys than girls, etc. Strategies involving killing people are not allowed.
Volatility Arbitrage, and the changing markets
The Black-Scholes analysis underpins much of modern financing. Today I am going to take an axe to one of its primary underpinnings. The Black-Scholes analysis depends, among other things, on the idea that volatility can be represented by a single number which is independent of the time over which you mention it.
Suppose that we have a random walk made up of randomly sampling a probability distribution, plus a general tendency to move in some direction. I.e. 


then its clear that for a random walk if we sample over a time that is twice as long, (i.e., contains two samples from the distribution X added together), then we have 

Now if the market were perfectly efficient, we would know that this must be the case, since if it is not the case, we can obtain an arbitrage opportunity in the following way. (Today we ignore all frictions and transaction costs). Suppose that I have £1,000,000 in cash, and so I decide to take a short position worth £1,000,000 in some index, say the FTSE100 while simultaneously taking a long position in the same index. The only difference is that I am going to rebalance the long position at the open and the close every day to be worth exactly £1,000,000 by using my cash to buy or sell as needed, whereas I will rebalance the short position only every thirty days. The idea is that if volatility is greater on a day to day basis than on a thirty day basis, then by buying high and selling low I can make an incremental profit while, in the main, being hedged against market moves. The open and close data for the FTSE100 is widely available. Ideally I would like to have the tick data so I could look at rebalancing on shorter timescales. Sadly that data appears to be very expensive :(.
Anyway, here is the result of the strategy on the FTSE100 since 1984.

Notice how the strategy basically fails until 2000, and then is quite successful.
I find this graph fascinating. We are looking at the evolution of the market in action. In essence, from 2000, we see the emergence of a term structure, after which the strategy routinely makes money. Note that as we are very close to Beta-neutral, this strategy can be levered up and would need to be, as the absolute returns are not exactly great. However, note that the volatility of the underlying instruments is likely to be much greater than that of the composite index, so the returns would be greater if we applied this strategy individually to each of the constituents. That would mean much more work for me to back test it. 🙂
I suspect that the change in term structure is related to the rise of algorithmic trading. In essence, this strategy is the opposite of trend following. If you trade based on trends, you make the trends shorter and steeper and hence increase volatility. Its plausible that this results in higher volatility on short time scales compared to longer ones. An alternative explanation is that options trading has calmed longer term volatility.
Another interesting feature of this term structure applies to options pricing. Since options are priced via Black Scholes based on the volatility, and since measuring volatility on a monthly rather than a daily basis would give you different measures of volatility, then they will also give you different prices. This is already known in finance, where the implied volatility of longer term options is often less than that of shorter term options.
Still, its fascinating to me to watch how the evolution of the market and trading ideas has created an inefficiency which did not appear to exist in the past. Probably some Quant based Hedge funds are already trading on this idea, and as it becomes more heavily traded it will disappear.
Valuing Companies: Apple Edition
So I am considering a long position in Apple. This post will serve as my investment case, an attempt to apply the mindset of Graham and Dodd. I have a shares Isa, in which I hold a portion of my savings. I try to find undervalued companies and sectors, and aim to hold for a longish time period. My current holdings are BG Group, Man Group, Lamprell, Schroder’s Real Estate Investment Trust, and a hedged Nikki positions through the MSCI Sterling hedged ETF, Cazenove Smaller Companies Fund, and Standard Life Equity Unconstrained.
Firstly, I will set out how I think about valuing companies in the abstract. As a shareholder, you live in a gray area of the investing landscape. You have a share in the assets and liabilities of the company, and also a share in current and future profits. I like to think about how a share price reflects a company as a going concern, which means I need to strip out of the market capitalisation those assets and liabilities that are independent of daily operations. Most commonly this involves bond issues. Bonds are more senior than equity, so they get first bite at the profits and also, in the event of bankruptcy, first claim on the assets. Thus, to understand how the market is valuing a company, we need to add its liabilities to its market cap. Similarly, in the unusual event of a company having a very strong net cash position, we should subtract it from the market capitalisation.
We can imagine, as it were, that the “market value of a business” = Market Cap + Liabilities – Non productive assets. We should not include such things as factories or offices, or those assets that are necessary for the daily operations of the company. The reasons for this are laid out in Graham and Dodds weighty tome “Security analysis”. When one comes to value a productive asset, its value is usually how much it produces. A company usually only sells such assets when they are no longer profitable, in which case there is no reason to think another company could profitably employ your factory, so its value drops to its land value. As an investor, we cannot know for certain how a company is valuing its productive assets, so in the interests of safety, assume you will get nothing from them that is not fully factored into the profit expectations.
Apple produces an interesting test case for this way of thinking, as its strong cash position materially affects its market cap, despite having almost no debt. According to its most recent 10-Q (interim statement for UK readers), it has around $68.7bn in liabilities, and around $158.6bn dollars of non productive assets, mostly in long dated securities and cash. The enterprise value of Apple is therefore its 400bn market cap, less $70bn in net non productive assets, for $330bn. This is the value that should be used for PE ratios. Last years apple earnings were around $41bn consensus estimates suggest it will be around $45bn this year and $50bn the year after. This gives an effective PE ratio of around 8. To put this in perspective, Google is valued at around 24 times earnings, Microsoft and Oracle are measured at around 15 times earnings. (In fairness, these are just the values from the FT website, not the adjusted values I laid out above for apple). This suggests to me that Apple is pretty cheap for a Tech company. Mean reversion is the most powerful force in market dynamics, so I would expect to see this valuation gap resolve itself one way or another.
As is often pointed out, the stock market is a forward looking vehicle, so let us ask what this stock price is predicting. To me this suggests that the Stock market is expecting Apple earnings to halve. If they did so then Apple would be fair valued as a tech company at around 15 times earnings. This does not seem plausible to me. It is true that as smart phones have become a commodity margins are likely to come under pressure, and that Google is at a huge premium because the market is very excited about driverless cars and Google glasses. Apple has always been extremely secretive about product development, are we certain that Apple does not have another game changing device up its sleeve? Apple has a fantastic brand, and huge brand loyalty. Smart phones are a fast growing market, and so we could easily see Apple maintaining earnings even with falling margins. Moreover, the corporate culture of excellence that Steve Jobs built is likely to persist.
Market Timing
So we have set out a value case for Apple. However, market sentiment is a strange beast, and its clear that Apple is in a monster downtrend. Do you fight the trend? Do you catch a falling knife? Well, this is an area in which it helps to look at the big picture.

Apple with Support lines and down trend added.
So the question is, are we going to break through the support at $420? If it does, we are likely to see another big move lower, down to 380 or so. At the moment the chart looks squeezed between the top of its down trend and the support line. Over the next few days it will break out either higher or lower. The risk of buying now is that it might go lower. The risk of not buying is that it might break out to the up side by some 20% or so.
In such situations my inclination is not to bother too much with the charts. I intend to hold for a long time (two years at least), and so a temporary downwards movement is not such a big deal. Apple is a strongly cash generative company disconnected from its fundamentals (in a good way), so I see a buying opportunity. If your plan is to ride a short move, you have been warned.
Disclosure: I will probably initiate a long in Apple later today.
Is Equity Cheap?
This is the question which is dominating financial media at the moment. Case-Schiller point out that their cyclically adjusted PE ration (CAPE10), is above historically adjusted norms. My thesis in this post is that the CAPE10 actually indicates that the stock market is cheaply-fairly valued depending on the expected future path of interest rates. In fact, I am going to use Shiller’s own data to explain why I think he is wrong.
Equity Valuations
The most theoretically sound way to value equities is the present discounted cash flow. That is to say, the current intrinsic value of a stock is the sum of all future profits discounted by the risk free rate. Of course, we can never be sure about the future, so is born the concept of a risk premium, that equities should be valued slightly lower than their fair value because we have a high degree of uncertainty about the future. My preferred way of saying this in maths is:

where we have defined that R is the risk free interest rate, G is the growth of the company, and $\latex \rho$ is the equity risk premium, which is at heart, the uncertainty about growth and interest rates. The approximation follows from the formula for a geometric sum if one assumes that 
Using the Case Shiller data, and using the above analysis, I have plotted the PE ratio for ten year US treasuries along side the CAPE10 ratio for the S&P500, since 1950.

Notice the incredible correlation between bond returns and equity returns over the proceeding decades as tail risks of WW2, the cold war, and thermonuclear war abated.
So the question, “are stocks cheap”, is now seen in its proper context. Stocks are cheap if you expect interest rates to stay at their current levels for an extended period. If you expect that interest rates will normalise around 5% in the not to distant future, then stocks are fairly valued. I see think that interest rates are still some years away from 5%, and see rather evidence of continued tail risk from the Eurozone’s self inflicted misery. Notice quite what an aberration the tech bubble was. Even at the end of the dot com crash stocks were not especially cheap compared to bonds. Notice that stocks were incontrovertibly cheap post financial crisis in 2009. Anyway, I am cautiously optimistic in the long run/medium run for stocks, but still worried about the Eurozone. The ongoing crises in Europe seems temporarily in the background of investor’s minds, either because they believe that the ECB will bow to pressure and follow the other central banks, or because they believe that liquidity from other parts of the world will alleviate Europe’s problems despite ECB intransigence. I would not bet on either.
Disclosure, I am 30% in cash, 70% long equities, with 0% European exposure.
